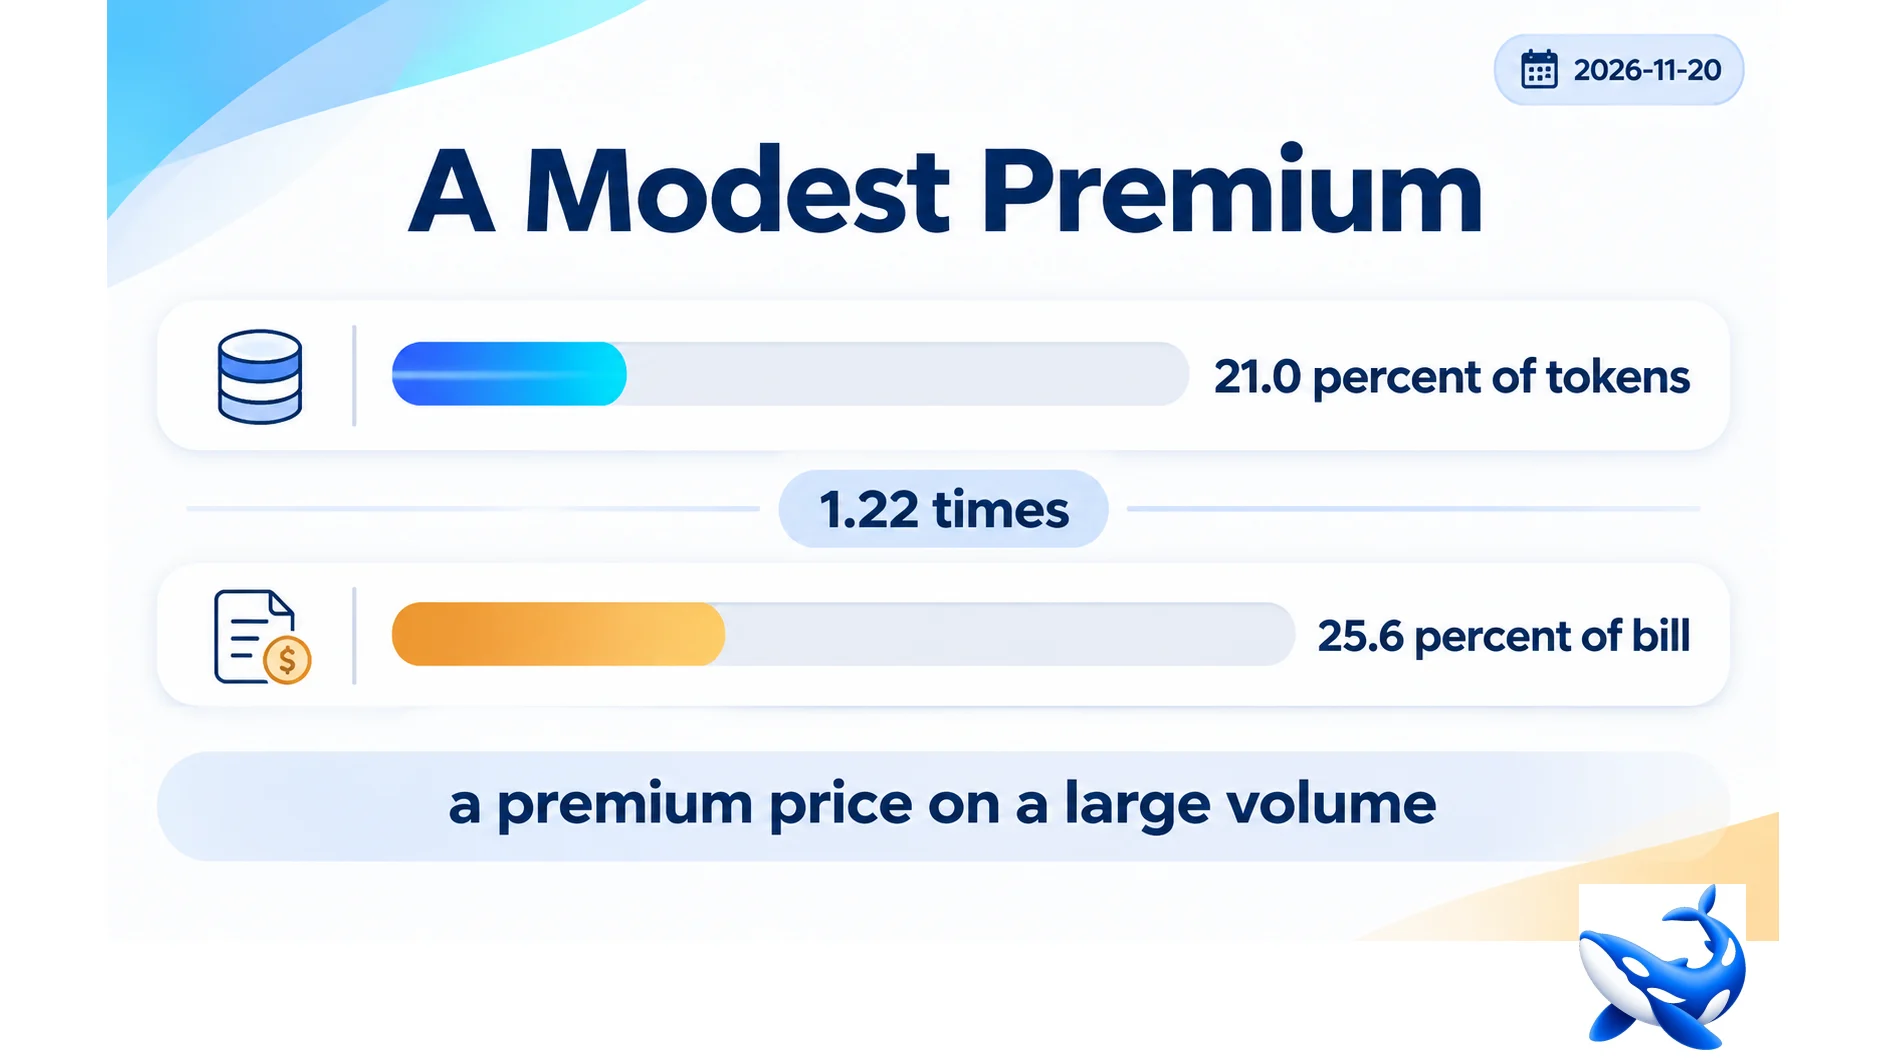
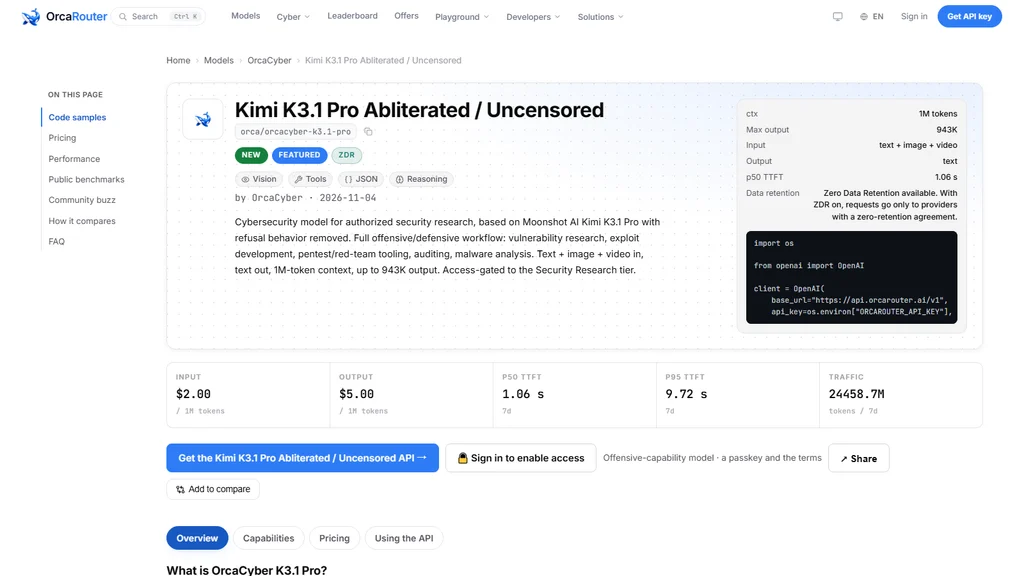
Twenty-four point two billion tokens is 21% of the cyber tier’s traffic and 25.6% of its spend, and that 1.22× gap is the smallest premium among the three cards that dominate the bill. OrcaRouter publishes both the traffic and the rate. The rate is on OrcaCyber K3.1 Pro pricing: $2.00 per million in, $5.00 out, $0.35 cached.
The spend table
| card | token share | bill share | ratio |
| Flash 1.0 | 31.9 % | 14.1 % | 0.44× |
| K3.1 Pro | 21.0 % | 25.6 % | 1.22× |
| Zero 1.5 | 16.9 % | 30.9 % | 1.83× |
| Hy4 | 11.1 % | 4.9 % | 0.44× |
| GLM 5.3 | 5.5 % | 8.6 % | 1.55× |
| GLM 5.3 Flash | 4.7 % | 2.1 % | 0.44× |
| Ultra 1.0 | 3.6 % | 10.1 % | 2.77× |
| MiniMax M3.1 Flash | 1.5 % | 0.7 % | 0.44× |
| Zero 1.0 | 1.3 % | 2.3 % | 1.83× |
| Qwen3.8 Flash Next | 1.3 % | 0.6 % | 0.44× |
| Hy4 Flash | 0.9 % | 0.05 % | 0.05× |
| MiMo V2.6 Flash | 0.3 % | 0.1 % | 0.44× |
The 1.22× is a moderate premium. The card’s blended rate is $2.75 against a tier average of $2.26, so each token costs 22% more than the tier’s own average token.
Its absolute bill is the second-largest at $66,622, behind Zero 1.5’s $80,476 and ahead of Flash 1.0’s $36,720. Together those three cards are 69.8% of the tier’s tokens and 70.6% of its spend — the tier is essentially three cards and a long tail.
What the 1.22 actually purchases
The premium over the band is 2.75× on the blend. What it buys, from published fields only:
A 943,718-token output ceiling. No other card exceeds 393,216. This is the single largest published differentiator in the tier.
A 1,048,576-token window. Shared with seven other cards, so not differentiating.
Vision across text, image and video input. Three cards list video input: this one, GLM 5.3 Flash and MiMo V2.6 Flash. So the capability is shared, but only with two cards, and both are on the $0.80 row.
Eleven supported parameters. The band cards list between seventeen and twenty-two. So this card’s API surface is *narrower* than the cheap cards’, which is the opposite of what a premium usually buys.
A quality score of 9 out of 10. Shared with Zero 1.0, Zero 1.5, Ultra 1.0 and GLM 5.3. Five cards at 9; the band cards are at 8.
No benchmark block at all. The card publishes zero evaluated rows, so none of the above is corroborated by a test score.
That list is the honest account, and it makes the premium narrower than it looks: one unique field (the ceiling), one field shared with four siblings (quality), and one shared with two cheap cards (video).
The volume that makes a premium cheap
Twenty-four billion tokens at a $2.75 blend is $66,622 a week, or $3.5 million a year if the rate holds. That is the largest single line item in the tier after Zero 1.5.
The reason the ratio is only 1.22 despite a 2.75× blend is the denominator. The tier average blend is $2.26, pulled up by Ultra 1.0 at $6.25 and Zero 1.5 at $4.125. Against that average, a $2.75 card is only modestly above.
Against the band alone the picture changes completely: $2.75 is 2.75× the $1.00 blend that six cards share. So the same card is “22% above average” and “2.75× the cheapest” depending on the comparison, and both are true.
That is the trap in a tier-average multiplier. It rewards membership in an expensive set. A card priced at the band on a tier where everyone else charges $4 would show a 0.25× ratio and look cheap; it would still be the card you would replace first if you wanted to spend less.
Where the traffic probably comes from
The card publishes video input support and a 943,718-token ceiling. Both point at large-document work: a full repository, a recorded session, a packet capture, a long disassembly.
The published latency supports that reading indirectly. A p50 of 1,069 ms is the second-fastest first-token latency in the tier, behind Flash 1.0’s 940 ms, on a card that generates at only 81.4 tokens a second. Fast first token and slow generation is the shape of a model that reads a large prefix quickly and then writes carefully.
Its p95 of 9,765 ms with two capped days out of seven says the tail is not controlled. Five days carry a readable p95 between 4,467 and 8,435; two days hit the 10,000 ms cap.
For a buyer, the practical read is that this card’s traffic is large-input work where a slow, long generation is acceptable — the opposite of the short-answer triage that the Hy4 cards are shaped for. The 1.22× premium is the price of that shape, and the tier average is the wrong yardstick for judging it.
The 288-token minute, and why the premium is small
Twenty-four point two billion tokens over seven days is 2.4 million tokens a minute, and the card’s own throughput says how much concurrency that implies.
| quantity | value |
| 7-day tokens | 24.23 B |
| tokens per minute | 2.40 M |
| single stream at 81.4 tok/s, per minute | 4,884 |
| implied parallel streams | ~492 |
| implied median answer | ~87 tokens |
Four hundred ninety-two streams is a large fleet, and it is the arithmetic consequence of a slow card carrying a large volume.
That is the cost side of the premium. K3.1 Pro at 81.4 tokens a second needs twice the concurrency of Flash 1.0 at 210.9 to move a third of the volume, because each stream produces fewer tokens.
Against that, the 1.22× bill-to-token ratio is mild. A buyer comparing this card to Flash 1.0 sees a 2.75× blend and a 0.25× throughput, which together mean roughly 11× the cost per million tokens per second.
The tier average hides that completely. It puts the card 22% above average when the same card is 2.75× the cheapest on the band. Both statements are true, and only one of them is a decision input.
The share also moves with the tier itself. Adding two cards — Hy4 Flash on the 18th, OrcaC2 1.0 on the 7th — grew the denominator, so this card’s 21.0% is smaller than the 21.6% the same volume produced in an eleven-card tier. The tokens did not change; the frame did. That is a routine effect of measuring a share in a set that is still growing, and it is the reason a share figure should always be quoted with the date it was measured.
OrcaCyber K3.1 Pro carries 21.0% of the cyber tier’s 115.17 billion tokens and 25.6% of its $260,202 bill — a 1.22× ratio, the smallest premium among the three cards that hold 70.6% of the spend. Its $66,622 weekly bill is the second-largest in the tier.
The 2.75× blend over the band buys one unique field (a 943,718-token output ceiling), one shared with four siblings (quality 9/10), and one shared with two cheap cards (video input) — plus a narrower parameter surface than the band offers, and no published benchmark block at all.
Sourcing note: the token volume, price rows, cache rate, ceiling, window, modalities, parameter list, quality score and latency percentiles are read from the OrcaCyber K3.1 Pro model API and card page on orcarouter.ai on 2026-11-20, with traffic, latency and error rates being OrcaRouter production telemetry for the seven days to that date. The tier totals, shares, multipliers and annualised figure are our own arithmetic at a 3:1 input-to-output mix. No competitor product is named or compared. Checked 2026-11-20.